Report 23-13 | September 2023
The State of Wisconsin Investment Board (SWIB) invests assets for the Wisconsin Retirement System (WRS) that are held in the Core Retirement Investment Trust Fund (Core Fund) and the Variable Retirement Investment Trust Fund (Variable Fund). Together, these funds are known as the Retirement Funds.
We provided unmodified opinions on the financial statements of the Retirement Funds investment activity for the year ended December 31, 2022. These financial statements report the investments and the investment activity of the WRS. Our unmodified opinions are included in SWIB’s 2022 Retirement Funds Annual Report. We conducted the financial audit by auditing SWIB’s financial statements of the Retirement Funds investment activity in accordance with applicable government auditing standards, issuing our auditor’s opinions, reviewing internal controls, and issuing our auditor’s report on internal control and compliance.
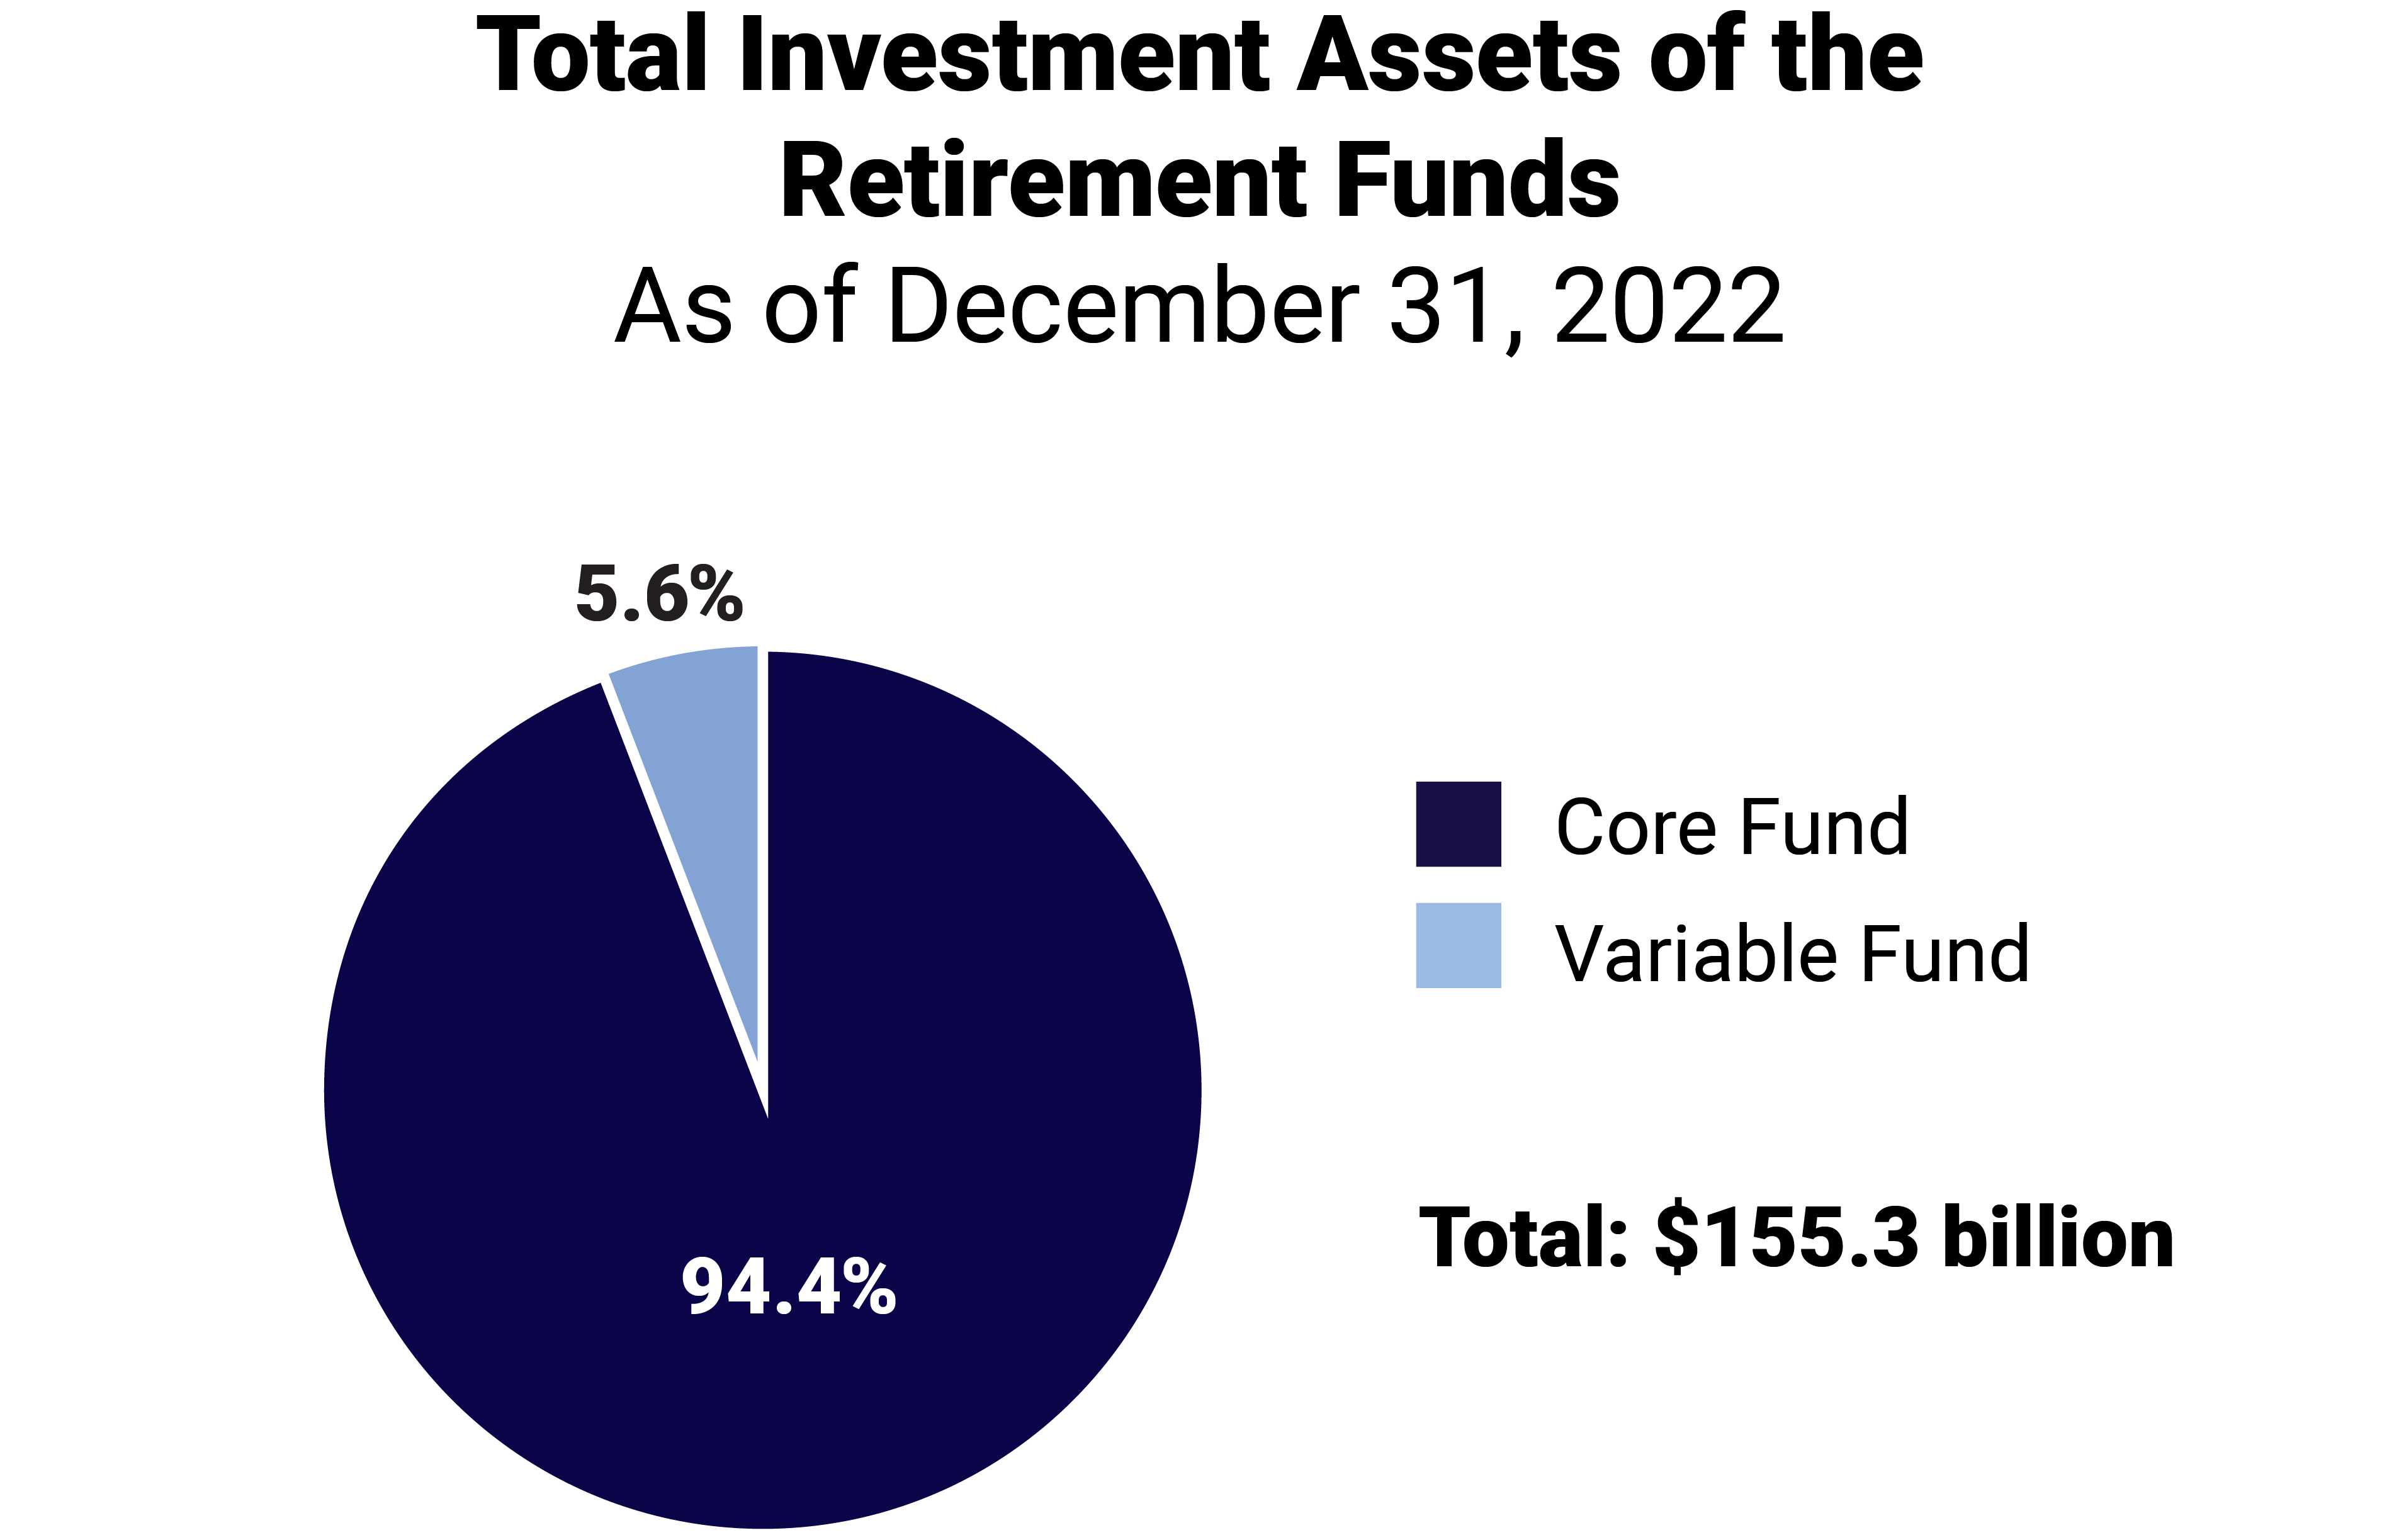
Total investment assets in the Core Fund were $146.6 billion as of December 31, 2022. The Core Fund investments include a distinct mix of investment types, such as equities, fixed income, and private fund investments.
Total investment assets in the Variable Fund were $8.7 billion as of December 31, 2022. The Variable Fund assets are primarily made up of public equities.
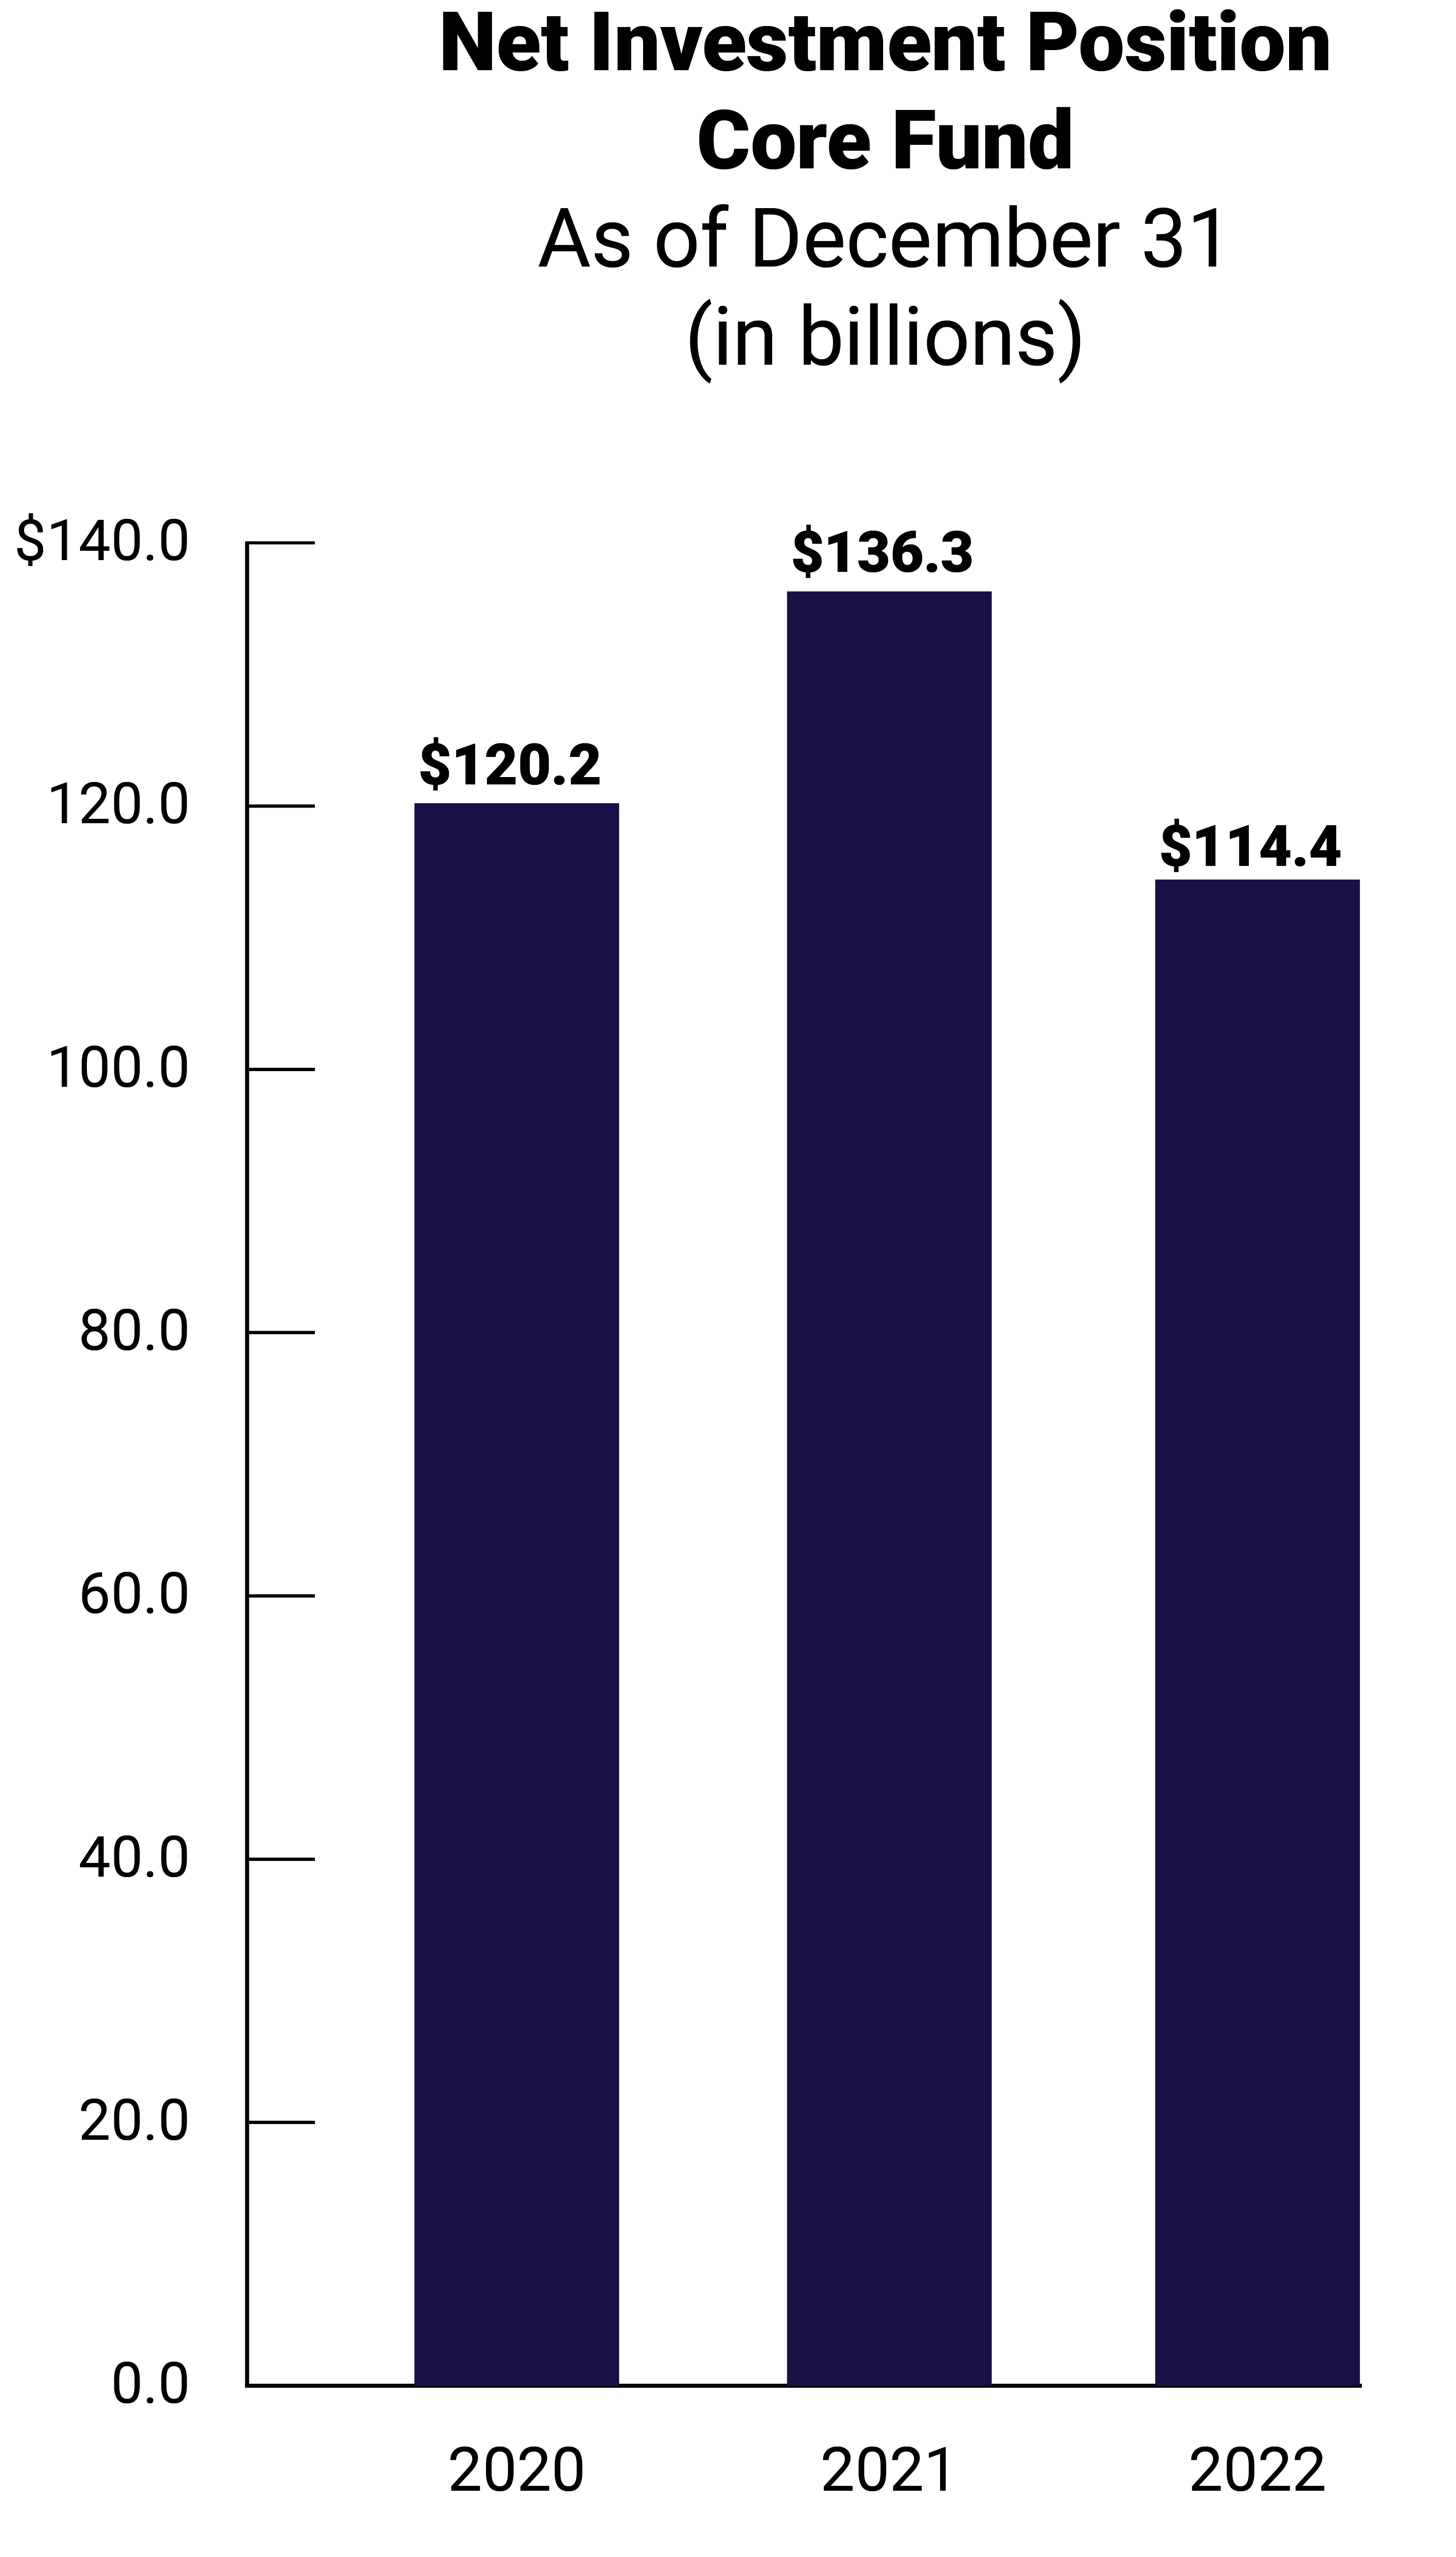
Net investment position is a measure of overall financial condition. The Core Fund reported net investment income of $20.0 billion in 2021 and a net investment loss of $17.4 billion in 2022. The reported one-year investment return, net of all fees and costs, decreased from 16.9 percent in 2021 to a negative 12.9 percent in 2022 and exceeded the benchmark of a negative 13.3 percent. The Core Fund investment return in 2022 is largely attributed to negative investment returns from public equity and fixed income investments.

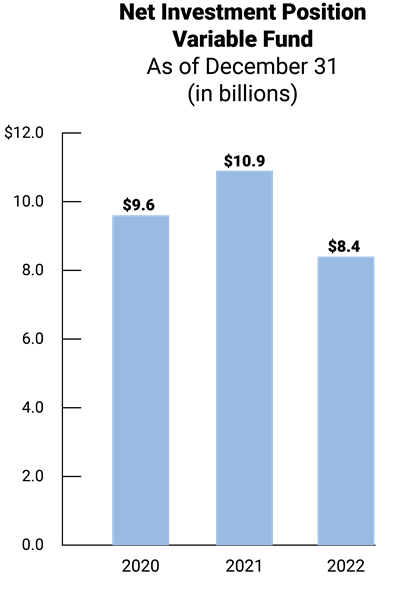
As noted, net investment position is a measure of overall financial condition. The Variable Fund reported net investment income of $1.8 billion in 2021 and a net investment loss of $1.9 billion in 2022. The reported one-year investment return, net of all fees and costs, decreased from 20.0 percent in 2021 to a negative 17.8 percent in 2022 and exceeded the benchmark of a negative 18.1 percent. The Variable Fund investment return in 2022 is attributed to negative investment returns from public equity investments.
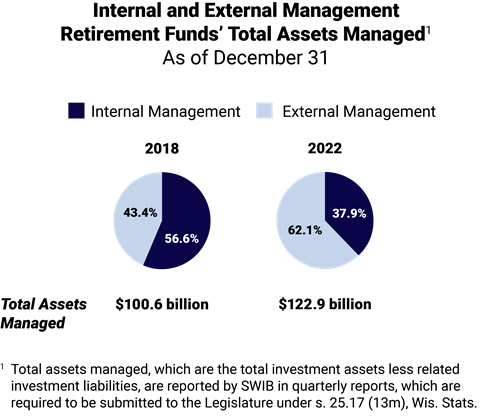
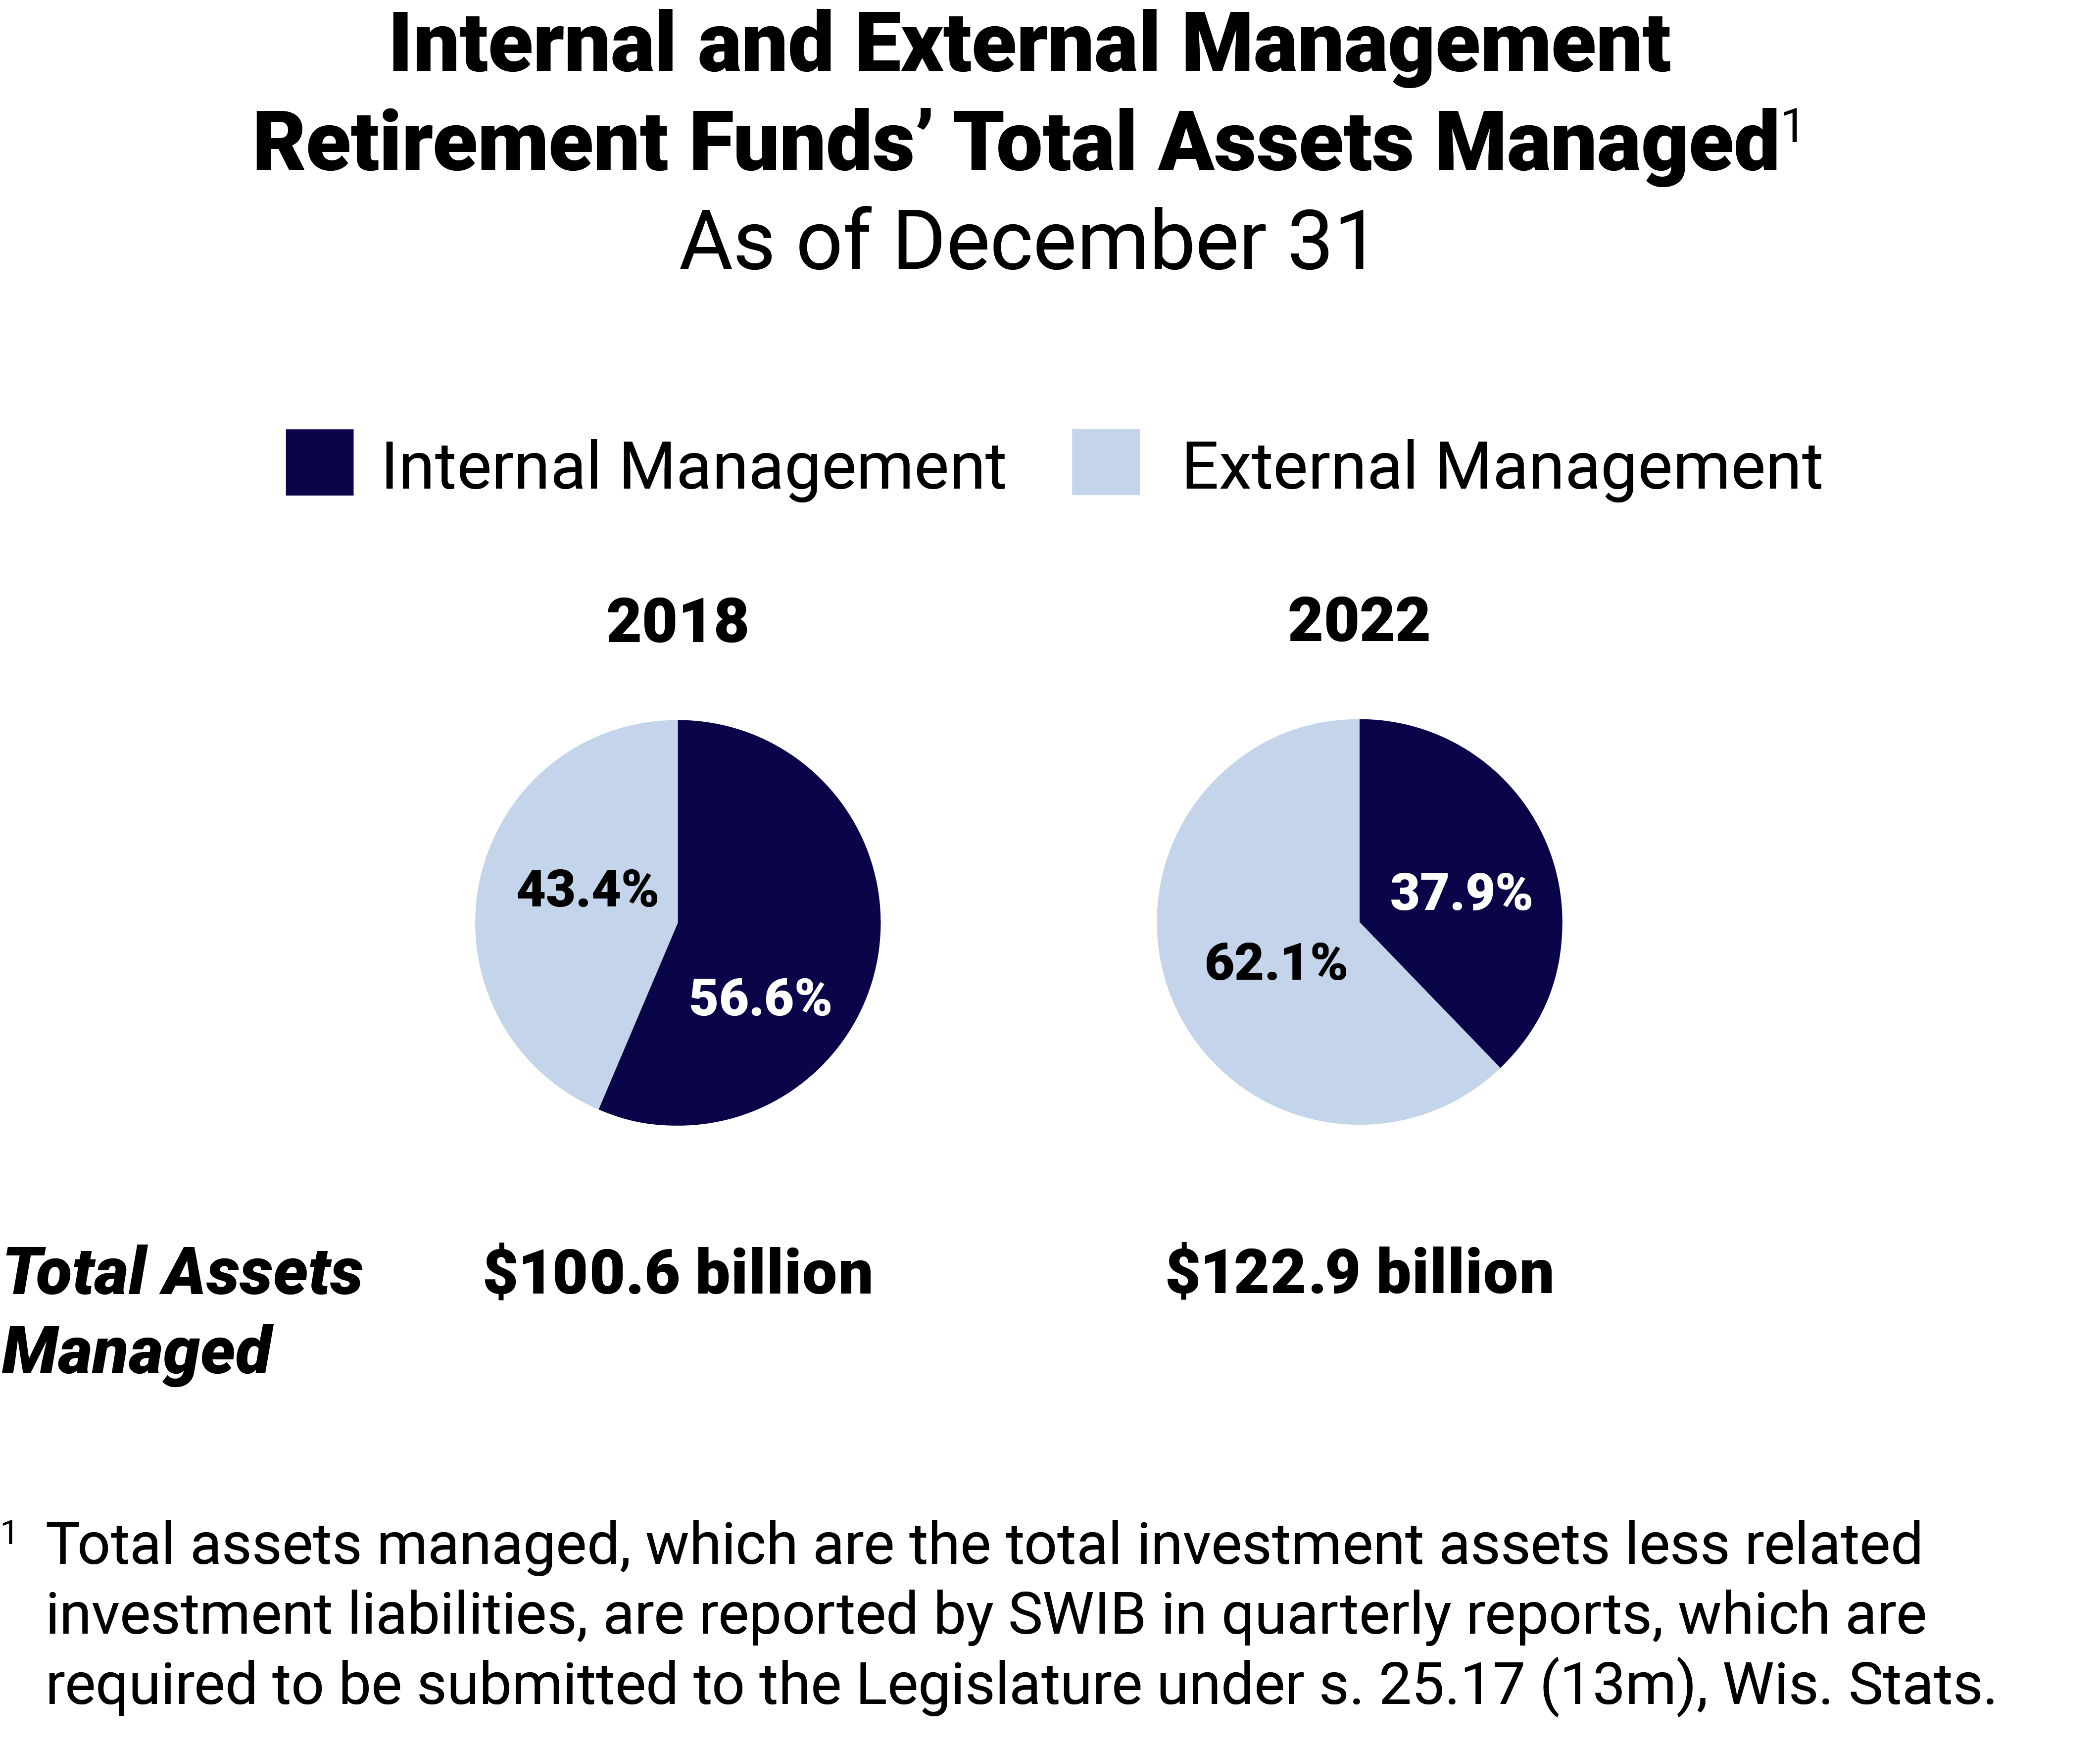
Historically, SWIB’s goal had been to increase the percentage of assets managed internally because external management is more expensive. The percentage of assets managed internally has decreased from 56.6 percent in 2018 to 37.9 percent in 2022. SWIB staff attribute decreases in internal management of assets in 2022 to the overall decline in the public equities and fixed income investments, which are largely managed internally. As total assets invested declined, the proportion of assets invested in private fund investments and hedge funds, which are managed externally, increased.
